Project 01

ProxiSanté
QGIS Plugin • Python • PyQGIS • Qt Designer • Graphical Modeler
QGIS Plugin — ProxiSanté
QGIS plugin developed in Python that automatically finds the fastest route from a starting point (Lambert-93 coordinates) to the nearest hospitals. Developed in pair as part of a university project at the University of Montpellier.
Python
PyQGIS
Qt Designer
Graphical Modeler
Routing
Network Analysis
01 — Features
The plugin automates road network analysis to calculate optimal routes to hospital facilities from anywhere in the territory.
📍 Coordinate Input
Enter starting coordinates in Lambert-93 (X,Y). Automatic format validation and error handling.
🛣️ Network Analysis
Calculate fastest routes to all hospitals via road network, with travel time in minutes.
🏆 Automatic Ranking
Sort hospitals from fastest to slowest. Extract and highlight the optimal route in red.
🗺️ QGIS Visualization
Automatic loading of results in QGIS with differentiated styles: blue for all paths, red for the fastest.
02 — User Interface — Qt Designer
The interface was designed with Qt Designer and integrated into QGIS via PyQGIS. Signals and slots enable communication between widgets and business logic.
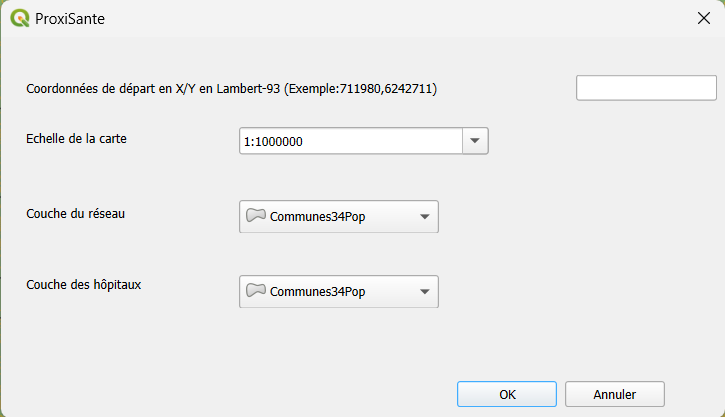
Final interface — coordinate input, scale and layer selection
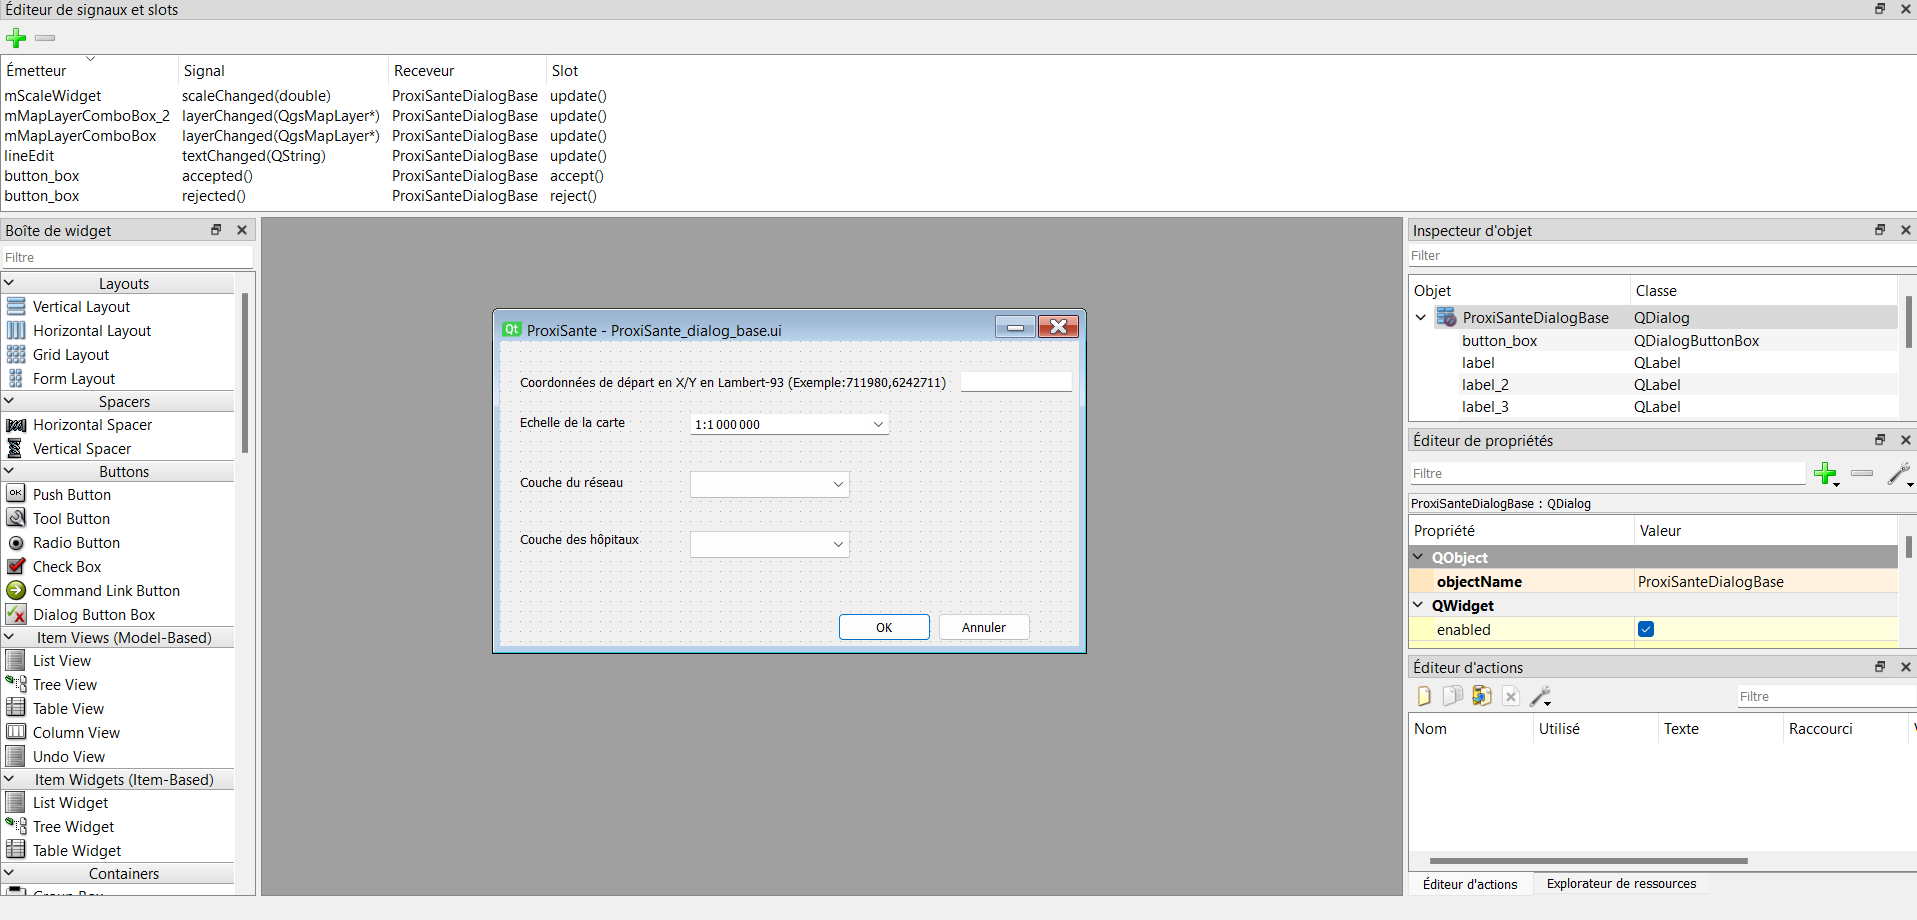
Qt Designer — signals and slots editor (mScaleWidget, mMapLayerComboBox, lineEdit)
Code excerpt — retrieving parameters from the interface and validating coordinates:
# Retrieve selected layers from ComboBoxes
textMapLayer1 = self.dlg.mMapLayerComboBox.currentText()
textMapLayer2 = self.dlg.mMapLayerComboBox_2.currentText()

# Retrieve and validate starting coordinates
Coordonnees_depart_texte = self.dlg.lineEdit.displayText().strip()
point_depart = self.Obtenir_Coordonnees_depart(Coordonnees_depart_texte)

def Obtenir_Coordonnees_depart(self, Coordonnees_depart_texte):
    try:
        Coordonnees = Coordonnees_depart_texte.strip().split(',')
        if len(Coordonnees) != 2:
            raise ValueError("Invalid coordinate format")
        lat, lon = map(float, Coordonnees)
        return QgsPointXY(lat, lon)  # Create a QGIS geographic point
    except (ValueError, IndexError) as e:
        QMessageBox.warning(None, "Error",
            f"Invalid format. Use: X,Y (e.g., 711980,6242711). Error: {str(e)}")
        return None
03 — QGIS Graphical Modeler
Algorithm processing is encapsulated in a QGIS graphical model that orchestrates the different steps: spatial indexing, route calculation, travel time calculation in minutes, sorting and optimal route extraction.
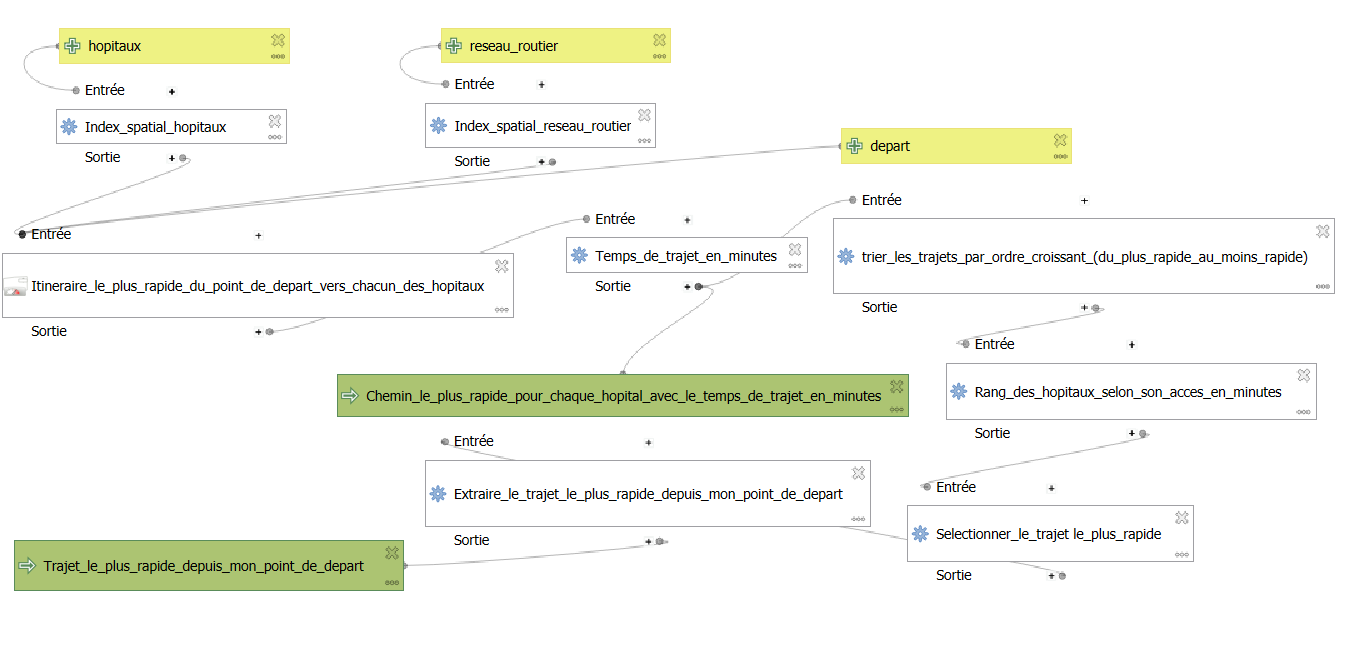
Fig. 1 — QGIS Graphical Model: complete processing pipeline from inputs (hospitals, road network, start) to outputs (sorted paths and optimal route)
① Spatial Indexing
Spatial index on hospitals and road network to optimize geographic queries.
② Route Calculation
Fastest route from starting point to each hospital in the network.
③ Time in Minutes
Conversion and calculation of travel time in minutes for each calculated route.
④ Sorting & Extraction
Sort in ascending order, selection and extraction of the fastest route to the optimal hospital.
03b — Python Model Export
The graphical model was exported to Python as a QgsProcessingAlgorithm class. This script is then imported and executed directly from the main plugin file, encapsulating the entire processing pipeline in a reusable QGIS algorithm.
Architecture — calling the model from the main plugin:
# Import the exported model from the graphical modeler
from .Temps_de_trajet_vers_hopitaux import Temps_de_trajet_vers_hopitaux

# Initialization and execution of the model with interface parameters
self.modele = Temps_de_trajet_vers_hopitaux()
self.modele.initAlgorithm()
results = self.modele.processAlgorithm(parameters, context, feedback)
Key excerpt — travel time calculation in minutes and hospital ranking:
# Travel time in minutes from path length (speed 80 km/h)
'FORMULA': 'round($length / (80 * 1000), 4) * 60'

# Ascending sort to find the fastest hospital
'EXPRESSION': 'to_real("temps_minutes")'
'ASCENDING': True

# Extraction of rank #1 path (fastest)
'FIELD': 'Classement', 'VALUE': 1
The complete code is available on the Codeberg repository.
04 — Results and Visualization
Results are automatically loaded into QGIS with differentiated symbology. Paths to all hospitals appear in blue, the optimal route to the nearest hospital is highlighted in red.

Fig. 2 — Result in QGIS: paths to all hospitals (blue) and fastest route (red). Copy coordinates in Lambert-93 or WGS84 via right-click.
Code excerpt — automatic loading and styling of results in QGIS:
def charger_resultats(self, pathResult1, pathResult2):

    # All paths to hospitals — thin blue line
    vlayer1 = QgsVectorLayer(pathResult1, "Paths to hospitals", "ogr")
    if vlayer1.isValid():
        symbol1 = QgsLineSymbol.createSimple({
            'line_color': '0,0,255,255',   # Blue
            'line_width': '1'
        })
        vlayer1.renderer().setSymbol(symbol1)
        QgsProject.instance().addMapLayer(vlayer1)

    # Optimal route — thick red line
    vlayer2 = QgsVectorLayer(pathResult2, "Nearest hospital", "ogr")
    if vlayer2.isValid():
        symbol2 = QgsLineSymbol.createSimple({
            'line_color': '255,0,0,255',   # Red
            'line_width': '2'
        })
        vlayer2.renderer().setSymbol(symbol2)
        QgsProject.instance().addMapLayer(vlayer2)
05 — Installation — QGIS Plugin
The plugin can be installed directly from the QGIS plugin manager and appears in the Extensions menu and toolbar.
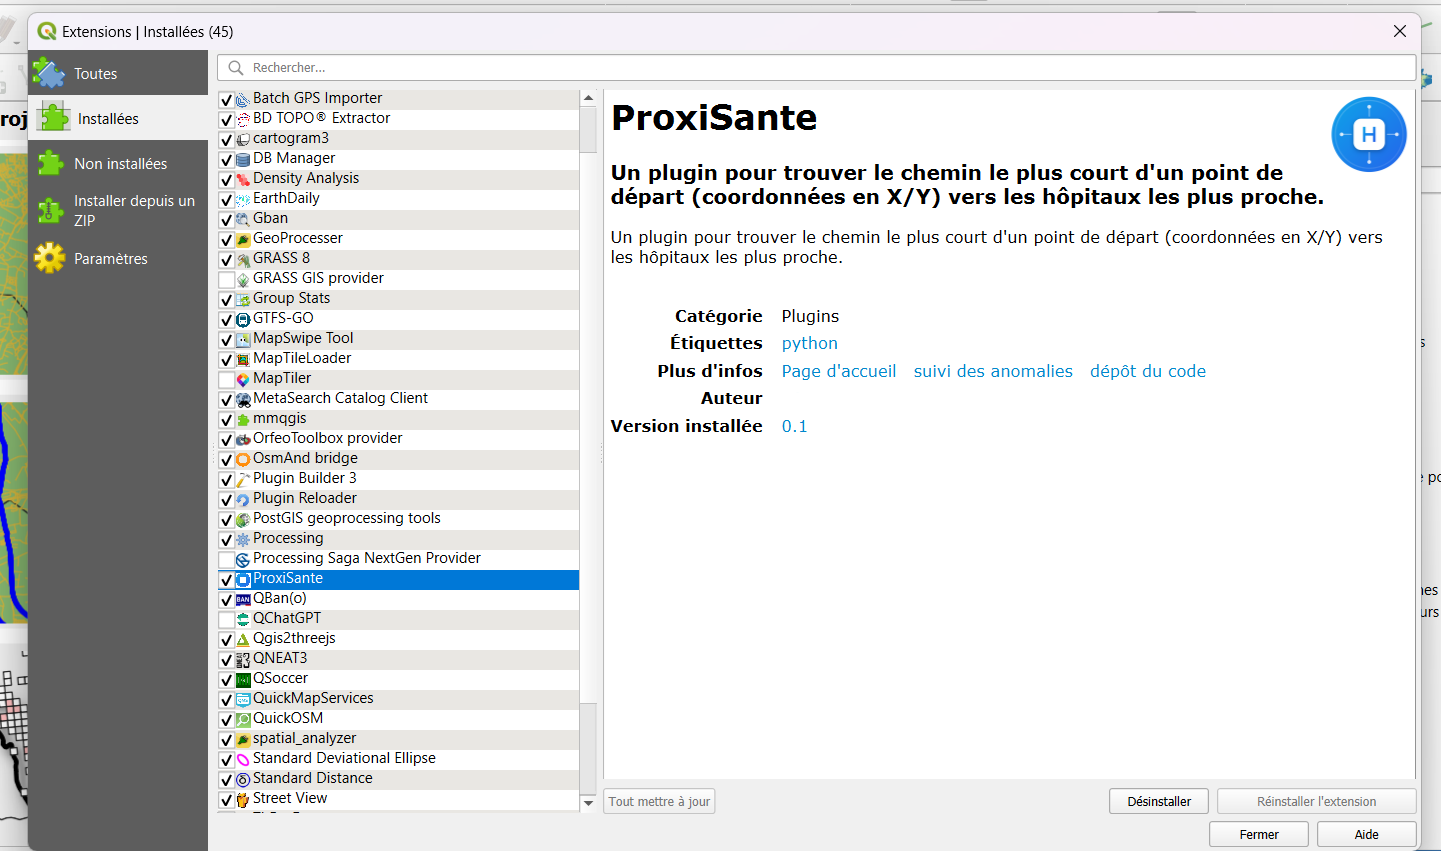
Fig. 3 — ProxiSanté Plugin installed in QGIS — plugin manager with description, category and links